Film editing analysis, made visible

Montage Maps

Explore how films are edited through verified shot counts, shot lengths, editing rhythm, sound and colour.

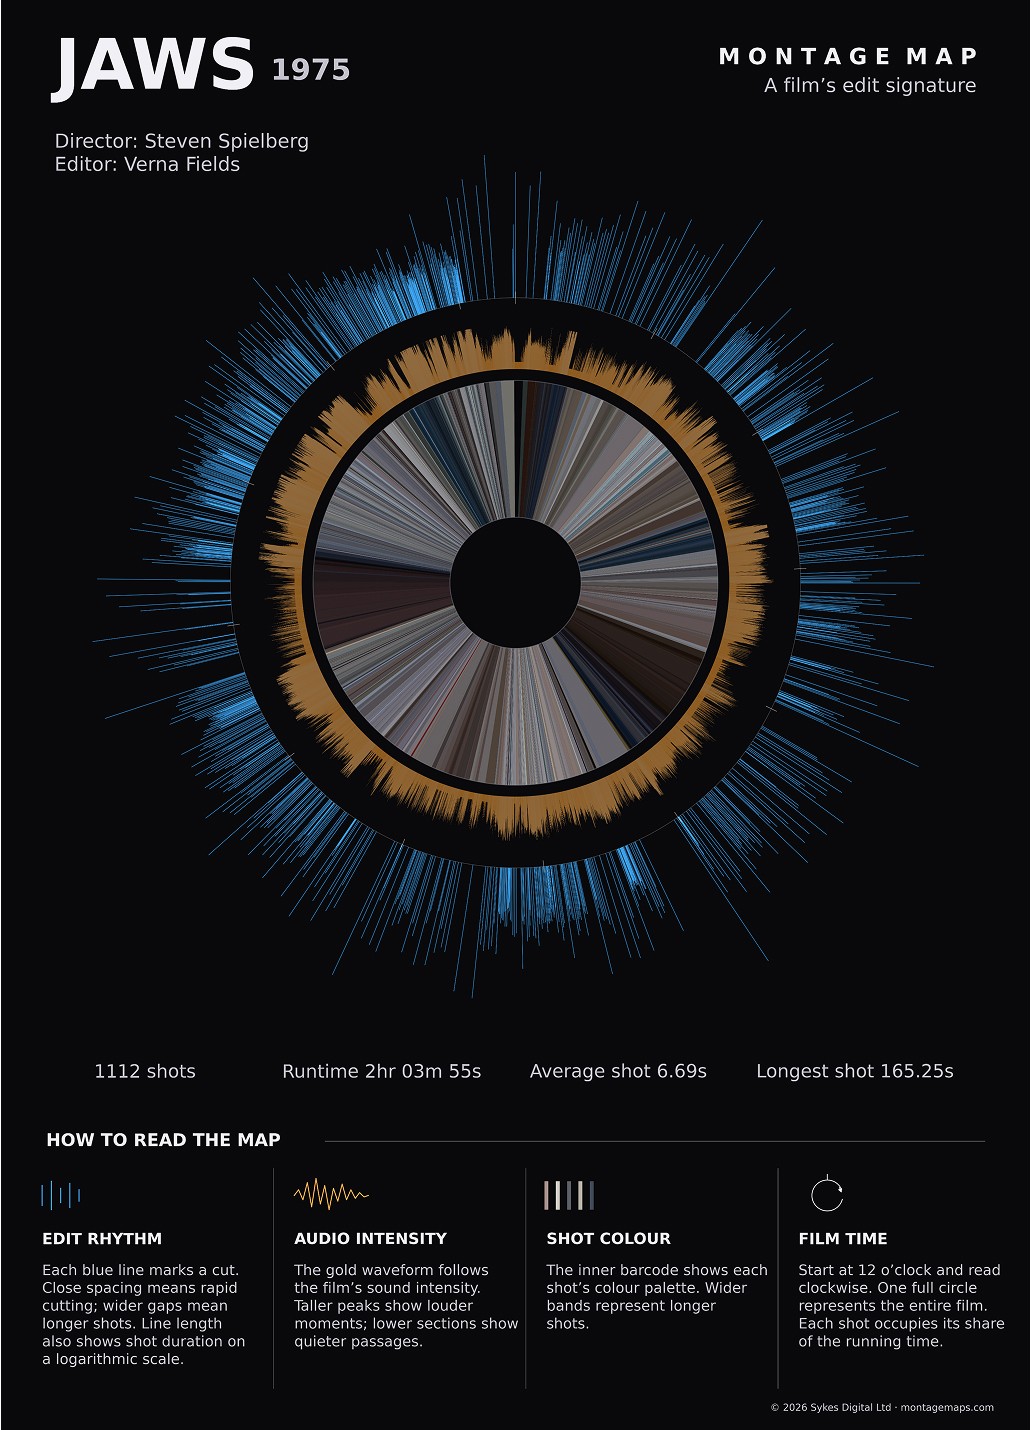
Each Montage Map displays an entire film, shot by shot, turning its editing structure into a single visual map. The project includes verified shot counts and timing data for Whiplash, Before Sunset and Jaws. Designed for film studies, editing research and anyone curious about how movies are constructed.

The archive

Films analysed

Shot analysis

How many shots are in these films?

Every film in Montage Maps is analysed shot by shot. Automated cut detection provides a starting point, but each edit is manually checked before the final shot count is published. End credits are excluded from the analysis to avoid distorting the average shot length.

Whiplash (2014)

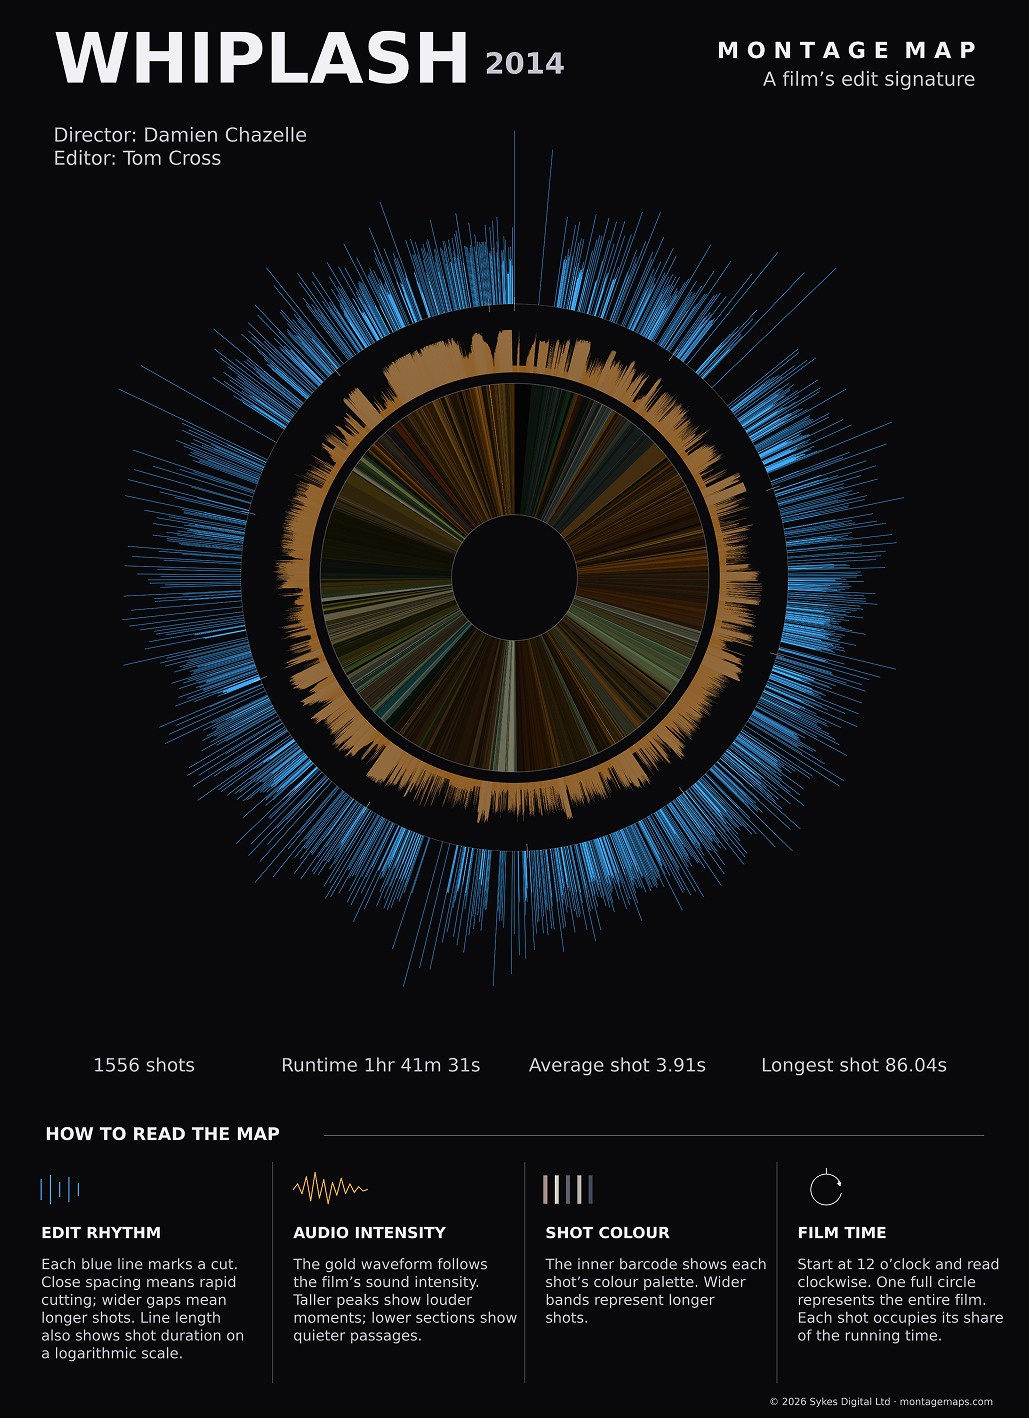
1,556 shots

Average shot length: 3.9 seconds

Before Sunset (2004)

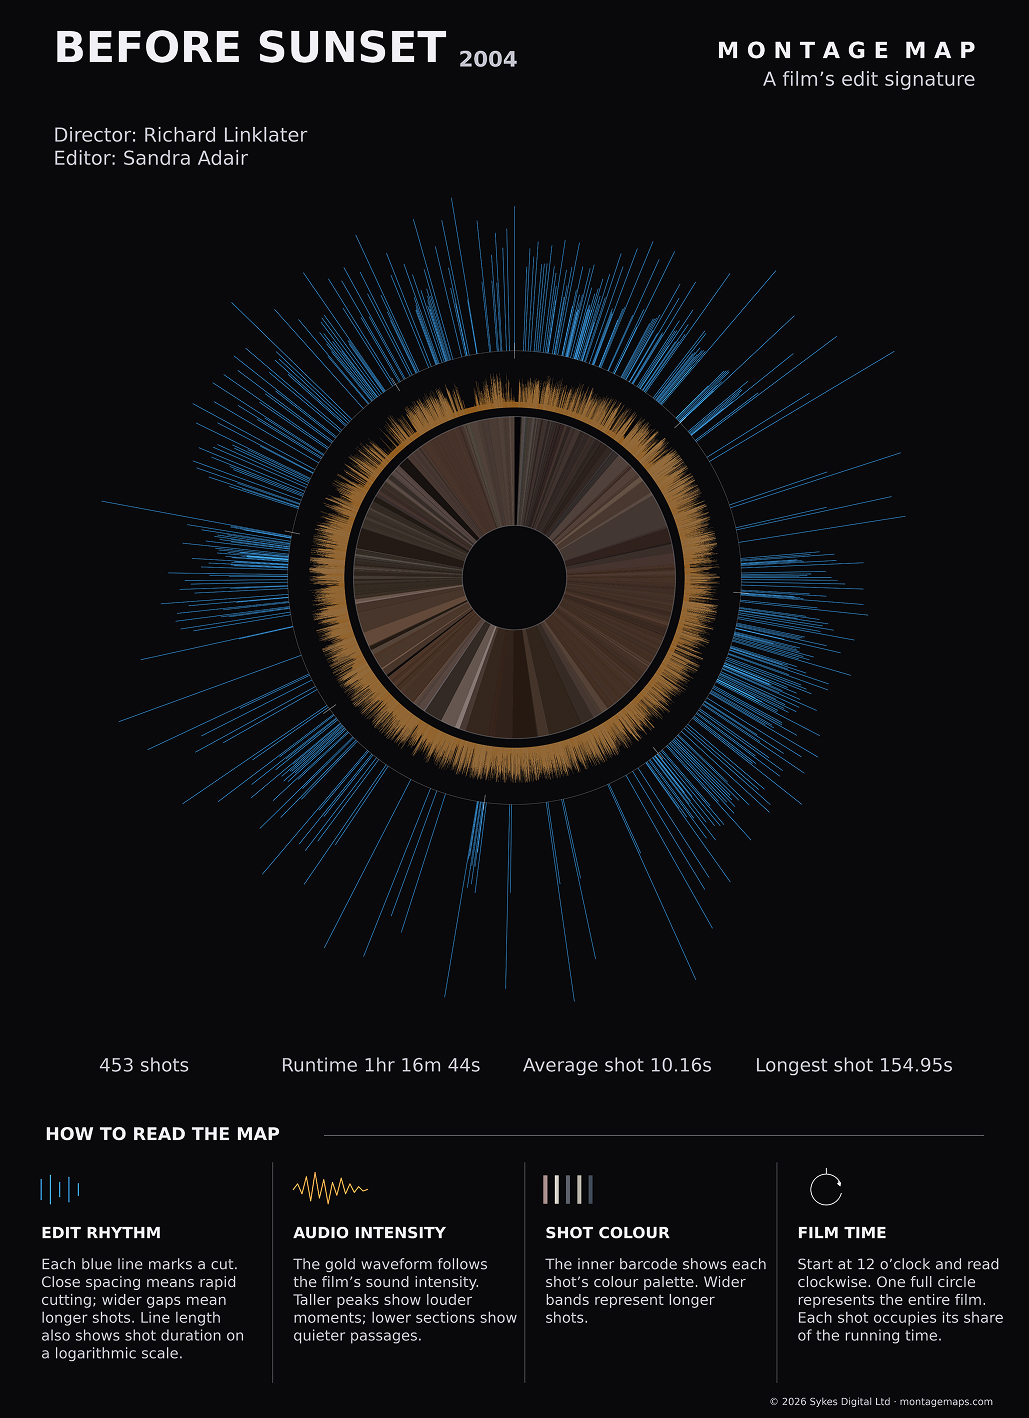
453 shots

Average shot length: 10.2 seconds

Jaws (1975)

1,112 shots

Average shot length: 6.69 seconds

The visual language

How to read a montage map

A Montage Map is a visual film-editing analysis showing every shot across the running time of a film.

Move over or tap a description to reveal that layer. Move around the map itself to read the film time and shot number.

Whiplash montage map
00:00:00:00 Shot 1
12 o’clock = start Move clockwise →

Full map Whiplash (2014)

Film studies

A visual tool for film studies

Film editing is normally experienced rather than seen. When we watch a movie, we rarely think about the cuts: the story simply unfolds before us. Montage Maps makes the underlying structure visible.

Every shot is plotted in chronological order, revealing changes in shot duration and editing rhythm across the whole film. Long takes stand apart from densely cut sequences, while sound intensity and colour add another layer of context. If you know a film well, you may even recognise particular scenes from their patterns.

I hope these maps will be useful to film students, filmmakers and film enthusiasts alike — not as a substitute for watching a film, but as a new way to study pacing, compare editing styles and see patterns that are otherwise easy to miss.

Behind the image

How the maps are made

Each Montage Map starts with automated shot-change detection. Software examines changes between video frames to identify likely edits. It is a useful first pass, but can miss dissolves, fades and cuts concealed by fast movement, such as whip-pans. It can also mistake changes within a shot for an edit.

That is why every detected edit point is reviewed, frame by frame where necessary. Missed cuts are added and false detections removed before the shot count and timing data are finalised.

End credits are excluded because they can distort average shot lengths and make comparisons misleading. As a result, the analysed duration may differ slightly from the film’s published running time.

Once the edits have been verified, the length of each shot is calculated and plotted in chronological order around a circular timeline. Longer blue spokes indicate longer shots; tightly packed short spokes reveal rapid cutting. The overall diameter of each map also varies according to the film’s duration.

The soundtrack is analysed separately to show changes in audio intensity, while colour samples taken throughout the film form the inner palette. Together, these layers trace the relationship between editing rhythm, sound and colour from beginning to end.

The aim is not to reduce editing to statistics, but to offer another way of looking at film structure. The maps become especially interesting when comparing styles across decades — for example, Citizen Kane and Whiplash.
About

The story behind Montage Maps

I work as a television editor in the UK and have always been fascinated by film editing.

While building Fabel, a tool that helps editors work with long interviews, I discovered software such as FFmpeg that can help detect shot changes in video. Impressed by what was possible, I began to wonder whether the editing pattern of an entire film could be represented in a single image.

That experiment became Montage Maps. The finished circular image looked surprisingly like an eye - a pleasing coincidence, and one I decided to keep.

If you want to know more about this project or there is a particular film you would like to see mapped feel free to get in touch.

[email protected]

Get new map updates

Be the first to hear when a new Montage Map is added.

Thanks for signing up for Montage Maps updates.